Some of the chatter that came back was amazing. BP has discovered the largest and most powerful well in history, and control of it may be outside existing technology. The previous record gusher was Union Oil Co.’s Lakeview well in Maricopa, California, which spewed out a staggering 100,000 barrels a day at its peak in 1910, and created an enormous oil lake in the central part of the state. My grandfather worked there for Standard Oil during the Great Depression, and 2o years later, oil was still everywhere.
Estimates for the BP well now range up to 50% more than that. The pressures at 18,000 feet are so enormous, that drilling two more relief wells might only result in creating two more oil spills. If Obama doesn’t want to take the nuclear option, (click here for my piece at http://www.madhedgefundtrader.com/june_4__2010.html ), then there will be no other alternative but for the spill to continue until the field exhausts itself or becomes capable, possibly some time next year.
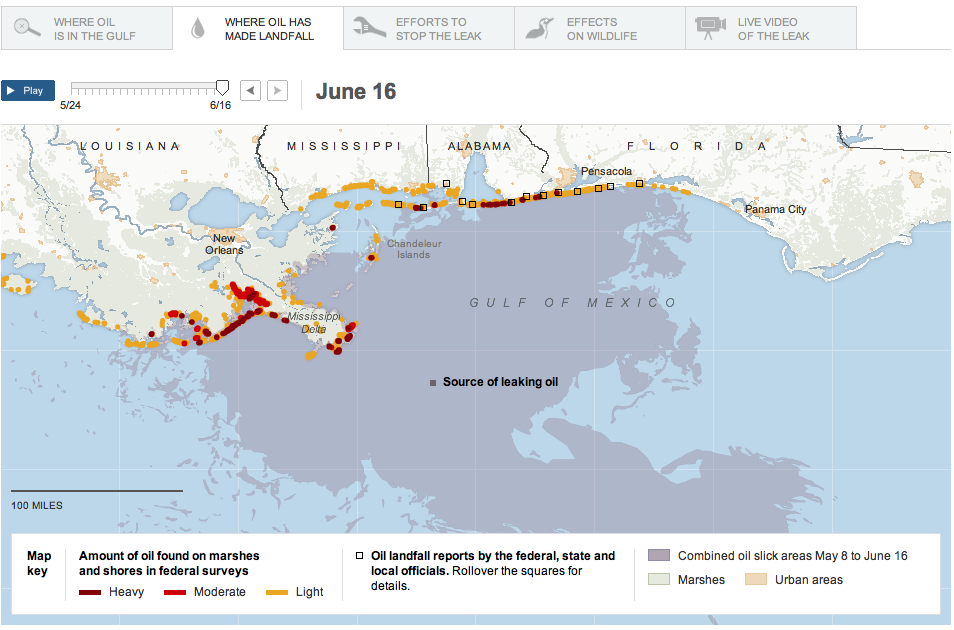
This is not the end of the world. Less than 1% of the spilled oil is ending up on the beaches. Watch TV, and that is not 150,000 barrels on the beach in Pensacola, Florida. Most of the crude is being moved parallel to the coast by the current and will eventually end up in the mid-Atlantic, where it will break down or dissipate. Tropical sunlight, salt water, and crude are all highly corrosive, and the three don’t last together long.
Using the high end estimates, and assuming that it takes a year to run out, possibly 36 million barrels will end up in the sea (pressure is declining). This is the same amount of oil that was dumped into the Atlantic during WWII, when 452 tankers were sunk by German U-boats, mostly along the US east coast, and when tar balls on the beach were a daily occurrence. This is on top of the 1.5 million barrels a year that leak into the Gulf through natural seepage, which no one ever notices.
One way or the other, this will end, and Western civilization will survive. And by the way, the crude price rise brought by the spill also marked up the value of BP’s reserves, easily allowing it to cover the cost of the clean up, no matter how big it is. This is how profitable this company is, and why they were so generous with a $20 billion contingency fund.
No sooner did I put out the call the buy the pariah stock at $29, than I hear Whitney Tilson of T2 Partners, one of the giants of the value corner in the hedge fund universe, is doing the same. Whitney has come up with a few more arguments which I haven’t thought of, which I will happily pass on.
For a start, no company has ever made more mistakes than BP, and panic is rife. Great time to buy. BP has the fourth largest revenue of any company in the world after, guess what, three other energy companies, Gazprom (GZPFY.PK), Exxon Mobile (XOM), and Royal Dutch Shell (RDS/A). Pre crisis Q1 operating profit estimates were at a staggering $34 billion, and the net at $22 billion.
While the environmental damage is substantial, it is nowhere near as bad as when 11 million barrels of crude poured into the Persian Gulf during Desert Storm in 1991, which is one sixth the size of the Gulf of Mexico.
Monday, June 28, 2010
BP Gossip
From the Mad Hedge Fund Trader: The Value Play on BP
Sunday, June 20, 2010
BP Reporting
This is all that is mentioned in the BP first quarter of 2010 report:
What is also very interesting from the 2009 annual report:
Here is what Mad Hedge is worried about:
From Bloomberg: Anadarko Says BP Should Pay After Being Reckless
Not that there isn't already enough oil out there in the sea (NYTimes graphic via The Big Picture):
Last not least, zero hedge has lots of interesting topographical sea maps of the area around spill:

On 20 April 2010, the semi-submersible drilling rig Deepwater Horizon owned and operated by Transocean Limited caught fire in the US Gulf of Mexico and subsequently sank. The rig was drilling an exploration well on a BP deepwater lease. BP is committed to doing everything in its power to contain the environmental consequences of the incident.Not even the death of the 11 people is mentioned.
What is also very interesting from the 2009 annual report:
Total exploration expense in 2009 of $1,116 million (2008 $882 million and 2007 $756 million) included the write-off of expenses related to unsuccessful drilling activities in the deepwater Gulf of Mexico ($391 million), India ($31 million), Angola ($28 million), Egypt ($27 million), and others ($31 million).Put this in relation to this quote from a Deepwater Horizon witness:
[Mike Williams, the chief electronics technician on the Deepwater Horizon, and one of the last workers to leave the doomed rig] said they were told it would take 21 days; according to him, it actually took six weeks.Now, how much is actually produced by BP down there in different fields in the Gulf every day?
With the schedule slipping, Williams says a BP manager ordered a faster pace.
"And he requested to the driller, 'Hey, let's bump it up. Let's bump it up.' And what he was talking about there is he's bumping up the rate of penetration. How fast the drill bit is going down," Williams said.
Williams says going faster caused the bottom of the well to split open, swallowing tools and that drilling fluid called "mud."
"We actually got stuck. And we got stuck so bad we had to send tools down into the drill pipe and sever the pipe," Williams explained.
That well was abandoned and Deepwater Horizon had to drill a new route to the oil. It cost BP more than two weeks and millions of dollars.
"We were informed of this during one of the safety meetings, that somewhere in the neighborhood of $25 million was lost in bottom hole assembly and 'mud.' And you always kind of knew that in the back of your mind when they start throwing these big numbers around that there was gonna be a push coming, you know? A push to pick up production and pick up the pace," Williams said.
Asked if there was pressure on the crew after this happened, Williams told Pelley, "There's always pressure, but yes, the pressure was increased."
Field 2009So make your own guess, how much is coming out there free flowing every day!
Thunder Horse 133'000 bpd
Atlantis 54'000 bpd
Mad Dog 35'000 bpd
Mars 29'000 bpd
Na Kika 27'000 bpd
Horn Mountain 25'000 bpd
King 22'000 bpd
Other 62'000 bpd
Total 387'000 bpd
Here is what Mad Hedge is worried about:
All of BP’s efforts to date have really been “Hail Mary’s” doomed to failure. The only real chance is to relieve the pressure by drilling several adjacent wells, and that will take months. If BP has discovered the mother of all fields with pressures so enormous, they can’t be controlled with modern technology, a possibility which some geologists admit, then more huge leaks will spring and the nuclear option will be the only one left. In the meantime, if a serious hurricane hits the region, a mathematical probability, then we will see the environmental equivalent of Chernobyl meets Katrina. In this scenario, you can kiss BP goodbye.So how big could the field be, how much oil is down there that could potentially come up?
From Bloomberg: Anadarko Says BP Should Pay After Being Reckless
1 Billion Barrels?For comparison, Exxon Valdez spilled 0.27 million barrels into the sea. Around a million is estimated to have come already out of the current leak. BTW, BP has total net proved crude oil reserves (not considering natural gas reserves) of 10.5 billion barrels.
The ruptured well may hold as much as 1 billion barrels, the Times reported, citing Rick Mueller, an analyst at Energy Security Analysis in Massachusetts. BP previously estimated the field contained 50 million to 100 million barrels of oil, the U.K. newspaper said.
Not that there isn't already enough oil out there in the sea (NYTimes graphic via The Big Picture):
Last not least, zero hedge has lots of interesting topographical sea maps of the area around spill:
Saturday, June 12, 2010
Palladium Production
| Source: "Platinum 2010" by David Jollie (from Johnson Matthey) | ||||||
| Supply | ||||||
| 1'000 oz | 2005 | 2006 | 2007 | 2008 | 2009 | |
| South Africa | 2'605 | 2'775 | 2'765 | 2'430 | 2'370 | |
| Russia | ||||||
| Primary | 3'135 | 3'220 | 3'050 | 2'700 | 2'675 | |
| Stock Sales | 1'485 | 700 | 1'490 | 960 | 960 | |
| North America | 910 | 985 | 990 | 910 | 755 | |
| Zimbabwe | 125 | 135 | 135 | 140 | 180 | |
| Others | 145 | 135 | 150 | 170 | 160 | |
| Total Supply | 8'405 | 7'950 | 8'580 | 7'310 | 7'100 | |
| Total Production | 6'920 | 7'250 | 7'090 | 6'350 | 6'140 | |
| Gross Demand | ||||||
| Autocatalyst | 3'865 | 4'015 | 4'545 | 4'465 | 4'050 | |
| Chemical | 415 | 440 | 375 | 350 | 325 | |
| Dental | 815 | 620 | 630 | 625 | 615 | |
| Electrical | 1'275 | 1'495 | 1'550 | 1'370 | 1'270 | |
| Investment | 220 | 50 | 260 | 420 | 625 | |
| Jewellery | 1'490 | 1'140 | 950 | 985 | 815 | |
| Other | 265 | 85 | 85 | 75 | 70 | |
| Total Gross Demand | 8'345 | 7'845 | 8'395 | 8'290 | 7'770 | |
| Recycling | ||||||
| Autocatalyst | -625 | -805 | -1'015 | -1'140 | -965 | |
| Electrical | -305 | -290 | -315 | -345 | -395 | |
| Jewellery | -60 | -135 | -235 | -130 | -70 | |
| Total Recycling | -990 | -1'230 | -1'565 | -1'615 | -1'430 | |
| Total Net Demand | 7'355 | 6'615 | 6'830 | 6'675 | 6'340 | |
| Movements in Stocks | -435 | 635 | 260 | -325 | -200 | |
| 1 t = 32'150.75 oz | ||||||
| t | 2005 | 2006 | 2007 | 2008 | 2009 | |
| South Africa | 81.02 | 86.31 | 86.00 | 75.58 | 73.72 | |
| Russia | ||||||
| Primary | 97.51 | 100.15 | 94.87 | 83.98 | 83.20 | |
| Stock Sales | 46.19 | 21.77 | 46.34 | 29.86 | 29.86 | |
| North America | 28.30 | 30.64 | 30.79 | 28.30 | 23.48 | |
| Zimbabwe | 3.89 | 4.20 | 4.20 | 4.35 | 5.60 | |
| Others | 4.51 | 4.20 | 4.67 | 5.29 | 4.98 | |
| Total Supply | 261.42 | 247.27 | 266.87 | 227.37 | 220.83 | |
| Total Production | 215.24 | 225.50 | 220.52 | 197.51 | 190.98 | |
| Gross Demand | ||||||
| Autocatalyst | 120.21 | 124.88 | 141.37 | 138.88 | 125.97 | |
| Chemical | 12.91 | 13.69 | 11.66 | 10.89 | 10.11 | |
| Dental | 25.35 | 19.28 | 19.60 | 19.44 | 19.13 | |
| Electrical | 39.66 | 46.50 | 48.21 | 42.61 | 39.50 | |
| Investment | 6.84 | 1.56 | 8.09 | 13.06 | 19.44 | |
| Jewellery | 46.34 | 35.46 | 29.55 | 30.64 | 25.35 | |
| Other | 8.24 | 2.64 | 2.64 | 2.33 | 2.18 | |
| Total Gross Demand | 259.56 | 244.01 | 261.11 | 257.85 | 241.67 | |
| Recycling | ||||||
| Autocatalyst | -19.44 | -25.04 | -31.57 | -35.46 | -30.01 | |
| Electrical | -9.49 | -9.02 | -9.80 | -10.73 | -12.29 | |
| Jewellery | -1.87 | -4.20 | -7.31 | -4.04 | -2.18 | |
| Total Recycling | -30.79 | -38.26 | -48.68 | -50.23 | -44.48 | |
| Total Net Demand | 228.77 | 205.75 | 212.44 | 207.62 | 197.20 | |
| Movements in Stocks | -13.53 | 19.75 | 8.09 | -10.11 | -6.22 | |
Tuesday, June 08, 2010
Subscribe to:
Posts (Atom)