Showing posts with label precious metals. Show all posts

Monday, March 23, 2015

Silver Mine Production (Update)

World Silver Mine Production

Update: 2015-03-23
year   mio oz       t       %
1989    527.3   16400    0.00
1990    533.7   16600    1.22
1991    501.6   15600   -6.02
1992    479.0   14900   -4.49
1993    453.3   14100   -5.37
1994    450.1   14000   -0.71
1995    479.0   14900    6.43
1996    485.5   15100    1.34
1997    530.5   16500    9.27
1998    553.0   17200    4.24
1999    549.8   17100   -0.58
2000    581.9   18100    5.85
2001    601.2   18700    3.31
2002    604.4   18800    0.53
2003    604.4   18800    0.00
2004    643.0   20000    6.38
2005    668.7   20800    4.00
2006    652.7   20300   -2.40
2007    675.2   21000    3.45
2008    684.8   21300    1.43
2009    700.9   21800    2.35
2010    742.7   23100    5.96
2011    749.1   23300    0.87
2012    819.8   25500    9.44
Source: USGS

Wednesday, March 13, 2013

Gold in CHF: Major Highs and Lows


The above chart (click to enlarge) has the Swiss Franc's gold price's major lows and highs of the last ten years (almost) since the low of CHF 471.85 on 2003-08-05.

I made the chart recently for the standard gold price in USD, so this is a check how much the look differs in CHF.

So below are the longest lasting periods to get a next major high in CHF.

In comparison to USD, in CHF we are only in the seventh longest draught in this ten year big uptrend and with -12.52 % draw down this time not out of line compared to previous periods. However, the last two recent periods combined do look a bit flat and do add up to soon 400 business days.

BTW, the number of periods with higher highs and higher lows in CHF is almost double the ones than if looked at in USD.

But whatever, time will tell:).

Major Highs

High No. 1
Date range:                   2006-05-11 - 2008-02-21
Length in business days:      465
High:                         874.98
Low:                          695.05
Draw down during this period: -20.56 %

High No. 2
Date range:                   2004-04-02 - 2005-06-23
Length in business days:      319
High:                         544.83
Low:                          482.57
Draw down during this period: -11.43 %

High No. 3
Date range:                   2010-06-08 - 2011-08-23
Length in business days:      315
High:                         1'435.80
Low:                          1'211.12
Draw down during this period: -15.65 %

High No. 4
Date range:                   2011-09-09 - 2012-10-04
Length in business days:      266
High:                         1'640.32
Low:                          1'442.72
Draw down during this period: -12.05 %

High No. 5
Date range:                   2008-02-21 - 2009-02-20
Length in business days:      261
High:                         1'041.00
Low:                          818.89
Draw down during this period: -21.34 %

High No. 6
Date range:                   2009-02-20 - 2009-12-04
Length in business days:      205
High:                         1'172.34
Low:                          989.26
Draw down during this period: -15.62 %

High No. 7
Date range:                   2012-10-04 - today
Length in business days:      113
High:                         1'669.74
Low:                          1'460.74
Draw down during this period: -12.52 %

High No. 8
Date range:                   2006-01-09 - 2006-05-11
Length in business days:      88
High:                         693.69
Low:                          693.15
Draw down during this period: -0.08 %

High No. 9
Date range:                   2009-12-04 - 2010-03-05
Length in business days:      65
High:                         1'223.16
Low:                          1'124.61
Draw down during this period: -8.06 %

Thursday, March 07, 2013

Gold Major Highs and Lows


The above chart (click to enlarge) has the gold price's major lows and highs (London fix) of the last decade since the very low of USD 252.80 on 1999-07-20.

Nevertheless, it has also been some time since the last all time high of USD 1'895.00 on 2011-09-05, and right now the gold price is closer to the last major low of USD 1'531.00 than making a new all time high. However there have been three other instances during this time frame in which it took even longer to make a next higher high (but that might go down to only two in another three weeks), and also where the draw down has been also bigger in the area of -20 to -30 %. See the details below.

Anyway, just some reading in the tea leaves, or in other words - the trend is your friend, until the bend at the end.
Major Highs

High No. 1
Date range:                   1999-10-05 - 2002-05-29
Length in business days:      669
High:                         325.50
Low:                          255.95
Draw down during this period: -21.37 %

High No. 2
Date range:                   2006-05-12 - 2008-03-17
Length in business days:      462
High:                         725.00
Low:                          560.75
Draw down during this period: -22.66 %

High No. 3
Date range:                   2008-03-17 - 2009-09-17
Length in business days:      378
High:                         1'011.25
Low:                          712.50
Draw down during this period: -29.54 %

High No. 4
Date range:                   2011-09-05 - today
Length in business days:      364
High:                         1'895.00
Low:                          1'531.00
Draw down during this period: -19.21 %

High No. 5
Date range:                   2004-12-02 - 2005-10-11
Length in business days:      214
High:                         454.20
Low:                          411.10
Draw down during this period: -9.49 %

High No. 6
Date range:                   2002-05-29 - 2003-02-05
Length in business days:      173
High:                         327.05
Low:                          302.25
Draw down during this period: -7.58 %

High No. 7
Date range:                   2004-04-01 - 2004-12-02
Length in business days:      170
High:                         427.25
Low:                          375.00
Draw down during this period: -12.23 %

High No. 8
Date range:                   2003-02-05 - 2003-10-03
Length in business days:      145
High:                         382.10
Low:                          319.90
Draw down during this period: -16.28 %

High No. 9
Date range:                   2009-12-02 - 2010-06-28
Length in business days:      139
High:                         1'212.50
Low:                          1'058.00
Draw down during this period: -12.74 %

High No. 10
Date range:                   2003-10-03 - 2004-04-01
Length in business days:      126
High:                         384.25
Low:                          370.25
Draw down during this period: -3.64 %

Thursday, July 19, 2012

CHF Value

The Gold Purchasing Power of the Swiss Franc: Minus 70 % in less than 10 years.
 
Data source: Thomson Reuters Datastream

Friday, August 12, 2011

Platinum Gold Ratio

On 2011-08-09 the Platinum Gold ratio hit 1 to 1. As you can see in the chart below, this is happening the third time in the last 10+ years. And it hasn't gone much lower historically nor did it stay there for very long. And it makes sense. Platinum is the rarer, finer, heavier, more precious "White Gold"! Since then actually Gold has retreated a bit and Platinum moved slightly up again. We will see...


XPTXAU.LBM chart

Sunday, May 29, 2011

Silver Mine Production

World Silver Mine Production
year   mio oz       t
1989 527.3 16400
1990 533.7 16600
1991 501.6 15600
1992 479.0 14900
1993 453.3 14100
1994 450.1 14000
1995 479.0 14900
1996 485.5 15100
1997 530.5 16500
1998 553.0 17200
1999 549.8 17100
2000 581.9 18100
2001 601.2 18700
2002 604.4 18800
2003 604.4 18800
2004 643.0 20000
2005 668.7 20800
2006 652.7 20300
2007 675.2 21000
2008 684.8 21300
2009 700.9 21800
Source: USGS

Sunday, November 28, 2010

Silver

Unlike gold, silver production is consumed to a very high degree!

From Wikipedia:


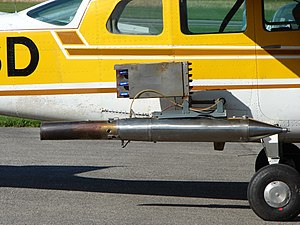
(a silver iodide generator for cloud seeding)
Silver ... has the highest electrical conductivity of any element and the highest thermal conductivity of any metal.

...

Today, silver metal is also used in electrical contacts and conductors, in mirrors and in catalysis of chemical reactions. Its compounds are used in photographic film and dilute silver nitrate solutions and other silver compounds are used as disinfectants and microbiocides. While many medical antimicrobial uses of silver have been supplanted by antibiotics, further research into clinical potential continues.

...

Currency

...

The name of the United Kingdom monetary unit "pound" (£) reflects the fact that it originally represented the value of one troy pound of sterling silver. In the 1800s, many nations, such as the United States and Great Britain, switched from silver to a gold standard of monetary value, then in the 20th century to fiat currency.

...

Photography and electronics

Photography used 30.98% of the silver consumed in 1998 in the form of silver nitrate and silver halides. In 2001, 23.47% was used for photography, while 20.03% was used in jewelry, 38.51% for industrial uses, and only 3.5% for coins and medals. The use of silver in photography has rapidly declined, due to the lower demand for consumer color film from the advent of digital technology, since in 2007 of the 894.5 million ounces of silver in supply, just 128.3 million ounces (14.3%) were consumed by the photographic sector, and the total amount of silver consumed in 2007 by the photographic sector compared to 1998 is just 50%.

Some electrical and electronic products use silver for its superior conductivity, even when tarnished. For example, printed circuits can be made using silver paints,[6] and computer keyboards use silver electrical contacts. Some high-end audio hardware (DACs, preamplifiers, etc.) are fully silver-wired, which is believed to cause the least loss of quality in the signal. Silver cadmium oxide is used in high voltage contacts because it can withstand arcing.

Mirrors and optics

Mirrors which need superior reflectivity for visible light are made with silver as the reflecting material in a process called silvering, though common mirrors are backed with aluminium. Using a process called sputtering, silver (and sometimes gold) can be applied to glass at various thicknesses, allowing different amounts of light to penetrate. Silver is usually reserved for coatings of specialized optics, and the silvering most often seen in architectural glass and tinted windows on vehicles is produced by sputtered aluminium, which is cheaper and less susceptible to tarnishing and corrosion. Silver is the reflective coating of choice for solar reflectors.

...

Small devices such as hearing aids and watches commonly use Silver oxide batteries due to their long life and high energy/weight ratio. Another usage is high-capacity silver-zinc and silver-cadmium batteries.
Furthermore from the Amalgam Wikipedia page, "Silver-mercury amalgams are important in dentistry".

FIXSLV.LBM chart

Saturday, May 22, 2010

Platinum Investment

Reuters: Redemption possible for platinum group ETFs
Physical investment demand for platinum rose 19 percent in 2009 to 660,000 ounces, boosted by strong growth of platinum and palladium ETFs, Johnson Matthey said.

Rhind said that investment alone, which represented less than 5 percent of total demand, was not enough to keep driving prices higher.

...

Autocatalytic converter demand traditionally accounts for half of the world's total platinum consumption. Last year, auto-sector buying fell to just 32 percent, JM said.
Businessweek: Chinese Platinum Jewelry Demand to Weaken, Johnson Matthey Says
Platinum investment demand rose 19 percent to 660,000 ounces last year, while palladium investment advanced 49 percent to an all-time high 625,000 ounces. ETF Securities Ltd. started exchange-traded funds backed by both metals in the U.S. at the beginning of the year.

...

Palladium may climb to a nine-year high of $700 an ounce in the next six months as the metal’s 2009 surplus of 760,000 ounces narrows, Johnson Matthey said. Palladium more than doubled in 2009, the best performance since at least 1993, and is up 26 percent this year at $514. The metal is unlikely to fall below $475 in the next six months, Johnson Matthey said.
Well, that is funny, because the free fall of the Palladium price before 2009 was just as stunning as its recent come back. The drop this week wasn't bad either, and now 475 looks already distant and sky high. Well, just show's that reading any predictions of people who don't show a track record is just a waste of time (and people who do have a respectable track record seem to make no specific predictions).
Total rhodium demand fell 21 percent last year to a 10-year low of 529,000 ounces, widening the metal’s surplus to 241,000 ounces, and Johnson Matthey said it expects another “large” surplus this year. The metal has gained 12 percent this year to $2,800 an ounce. Rhodium is mainly used in auto catalysts and also in the chemical and glass industries.

...

Ruthenium demand fell 18 percent to 574,000 ounces last year, and iridium consumption slipped 11 percent to 91,000 ounces, Johnson Matthey said. Ruthenium is mostly used for coating computer hard disks and iridium is used in spark plugs and for growing metal oxide crystals.

Saturday, February 13, 2010

Gold

From the World Gold Council (a bunch of gold mining corporations):
How much gold has been mined?
The best estimates available suggest that the total volume of gold ever mined up to the end of 2009 was approximately 165'000 tonnes, of which around 65% has been mined since 1950.

How much gold is still underground?
The major gold producers increased their reported reserves to 719.7 million oz or over 22,000 tonnes at the end of 2005, according to Metals Economics Group. Assuming a 10% recovery loss when the ore is extracted, this would amount to 14 years of gold production at 2005's level. In practice the amount of known resources remains fairly constant over time since the results of new exploration finds replace those resources that are exploited.

What is the average cost of mining per ounce?
The average cost of replacing and producing an ounce of gold rose to $428/oz in 2005, a ten-year high, according to Metals Economics Group, based on a study of 18 major gold producing companies. However, costs vary widely between companies and the mines themselves.

How big is a tonne of gold?
Gold is traditionally weighed in Troy Ounces (31.1035 grammes). With the density of gold at 19.32 g/cm3, a troy ounce of gold would have a volume of 1.61 cm3. A metric tonne (equals 1,000kg = 32,150.72 troy ounces) of gold would therefore have a volume of 51,762 cm3 (i.e. 1.61 x 32,150.72), which would be equivalent to a cube of side 37.27cm (Approx. 1' 3'').

Where does the word Gold come from?
The word gold appears to be derived from the Indo-European root 'yellow', reflecting one of the most obvious properties of gold. This is reflected in the similarities of the word gold in various languages: Gold (English), Gold(German), Guld (Danish), Gulden (Dutch), Goud (Afrikaans), Gull (Norwegian) and Kulta (Finnish).
With today's gold price of USD 1082.00 the total "market capitalization" of gold is:

USD 5'739'872'784'897.15

USD 5.7 trillion - 9.5% of 2008 world GDP or half of the currently estimated US bailout amount:-)


And what's the annual mining production?

The CRB Commoditiy Yearbook 2008 states for 2005:
2'470 t (record high was actually 1999/2000 with 2'570 t)
= 79.41 million ozt (82.6 million ozt)
= USD 85'924'156'234.52
= USD 85.9 billion (USD 89.4 billion)
So total world gold amount is equivalent of 66.8 years of 2008 world gold production.
P.S. 1 ozt = 31.1034768 g


And how much gold is there for any human being?

165'000'000'000 g / 6'692'030'277 people = 24.66 g / person (or 80% of a single troy once)


Here is an interesting back of the envelope calculation (thought they estimate double the amount of the WGC number and maybe make a too low assumption of today's gold production, nevertheless interesting):

If you took all of the gold in the world and put it in one place how much would there be?


And a National Geographic article about gold, mining, and its social impact:
In 2007 demand outstripped mine production by 59 percent.
...
According to the United Nations Industrial Development Organization (UNIDO), there are between 10 million and 15 million so-called artisanal miners around the world, from Mongolia to Brazil. Employing crude methods that have hardly changed in centuries, they produce about 25 percent of the world's gold and support a total of 100 million people. It's a vital activity for these people—and deadly too.
So annually: 80 mio ozt * 25% = 20 mio ozt; for lets say 10 mio workers this results in 2 ozt per worker, average per worker USD 2'000 market value - thought not what they get:
On school holidays, Rosemery sometimes helps her mother on the mountain. It is child labor, perhaps, but for a girl whose family is living hand to mouth, it also qualifies as her proudest achievement. "Last year I found two grams of gold," Rosemery says, almost giddily. "It was enough to buy my schoolbooks and uniform.
And furthermore:
The deadly effects of mercury are equally hazardous to small-scale miners. Most use mercury to separate gold from rock, spreading poison in both gas and liquid forms. UNIDO estimates that one-third of all mercury released by humans into the environment comes from artisanal gold mining.
...

View Mine Sites in a larger map
At the other end of the spectrum are vast, open-pit mines run by the world's largest mining companies. Using armadas of supersize machines, these big-footprint mines produce three-quarters of the world's gold. They can also bring jobs, technologies, and development to forgotten frontiers. Gold mining, however, generates more waste per ounce than any other metal, and the mines' mind-bending disparities of scale show why: These gashes in the Earth are so massive they can be seen from space, yet the particles being mined in them are so microscopic that, in many cases, more than 200 could fit on the head of a pin. Even at showcase mines, such as Newmont Mining Corporation's Batu Hijau operation in eastern Indonesia, where $600 million has been spent to mitigate the environmental impact, there is no avoiding the brutal calculus of gold mining. Extracting a single ounce of gold there—the amount in a typical wedding ring—requires the removal of more than 250 tons of rock and ore.
...
Up the road there is a basketball gymnasium that Newmont staffers jokingly refer to as "the second home of the Denver Nuggets."

The name is fitting for a Colorado-based gold-mining company, though there are no nuggets here. And therein lies the problem. Higher prices and advanced techniques enable companies to profitably mine microscopic flecks of gold; to separate gold and copper from rock at Batu Hijau, Newmont uses a finely tuned flotation technology that is nontoxic, unlike the potentially toxic cyanide "heap leaching" the company uses in some of its other mines. Even so, no technology can make the massive waste generated by mining magically disappear. It takes less than 16 hours to accumulate more tons of waste here than all of the tons of gold mined in human history. The waste comes in two forms: discarded rock, which is piled into flat-topped mountains spread across what used to be pristine rain forest, and tailings, the effluent from chemical processing that Newmont pipes to the bottom of the sea.

This method of "submarine tailings disposal" is effectively banned in most developed countries because of the damage the metal-heavy waste can do to the ocean environment, and Newmont practices it nowhere but in Indonesia. Four years ago an Indonesian court brought criminal charges against a Newmont subsidiary—even jailing five of its employees for a month—for pumping pollutants into the sea near its now defunct Buyat Bay mine on the island of Sulawesi. Newmont was acquitted of all charges in 2007. Despite critics' claims that the court caved in to the mining industry, Newmont defends its reliance on ocean dumping at Batu Hijau. "Land disposal would be cheaper but more damaging to the environment," argues Rachmat Makkasau, Batu Hijau's senior process manager. The tailings at Batu Hijau are released 2.1 miles offshore at a depth of 400 feet, above a steep drop-off that carries the waste down more than 10,000 feet. "We closely monitor the quality of the tailings, pipes, and seabed," says Makkasau. "At that depth, we are only affecting some 'sea insects.'"
...
Nowhere is the gold obsession more culturally entrenched than it is in India. Per capita income in this country of a billion people is $2,700, but it has been the world's runaway leader in gold demand for several decades. In 2007, India consumed 773.6 tons of gold, about 20 percent of the world gold market and more than double that purchased by either of its closest followers, China (363.3 tons) and the U.S. (278.1 tons). India produces very little gold of its own, but its citizens have hoarded up to 18,000 tons of the yellow metal—more than 40 times the amount held in the country's central bank.

India's fixation stems not simply from a love of extravagance or the rising prosperity of an emerging middle class. For Muslims, Hindus, Sikhs, and Christians alike, gold plays a central role at nearly every turning point in life—most of all when a couple marries. There are some ten million weddings in India every year, and in all but a few, gold is crucial both to the spectacle and to the culturally freighted transaction between families and generations. "It's written into our DNA," says K. A. Babu, a manager at the Alapatt jewelry store in the southwestern city of Cochin. "Gold equals good fortune."

This equation manifests itself most palpably during the springtime festival of Akshaya Tritiya, considered the most auspicious day to buy gold on the Hindu calendar. The quantity of gold jewelry Indians purchase on this day—49 tons in 2008—so exceeds the amount bought on any other day of the year throughout the world that it often nudges gold prices higher.

View Larger Map
Throughout the year, though, the epicenter of gold consumption is Kerala, a relatively prosperous state on India's southern tip that claims just 3 percent of the country's population but 7 to 8 percent of its gold market. It's an unusual distinction for a region that has one of the world's only democratically elected Marxist governments, but it is rooted in history. A key port in the global spice trade, Kerala gained an early exposure to gold, from the Romans who offered coins in exchange for pepper, cardamom, and cinnamon to subsequent waves of colonizers, the Portuguese, Dutch, English. But local historians say it was the region's revolt against the Hindu caste system (before which the lowest castes were allowed to adorn themselves only with polished stones and bones), and the mass conversion to Christianity and Islam that followed, that turned gold into something more than commerce: a powerful symbol of independence and upward mobility.
...
By themselves, none of these ceremonies captures how deeply gold is ingrained in the Indian economy. "Gold is the basis of our financial system," says Babu, the jewelry store manager. "People see it as the best form of security, and nothing else lets you get cash as quickly." Hoarding gold as an intergenerational family nest egg is an ancient tradition in India. So, too, is pawning gold jewelry for emergency loans—and then buying it back. Commercial banks still offer the service, after their attempt to stop it in the 1990s resulted in riots and suicides by debt-laden clients and a government command to continue the practice.

Many farmers in Kerala, however, prefer the speed and easy access of "private financiers" like George Varghese, who operates out of his home three hours south of Cochin. A balding man in his 70s, Varghese says he handles around half a million dollars in pawned gold a month, even more during harvest and wedding seasons. It's almost a perfect business, for even with interest rates that can reach one percent a day on short-term loans, very few people default. No Indian wants to let go of their gold. "Even when gold hit $1,000 an ounce, nobody sold their jewelry or coins," says Varghese. "This is their nest egg, and they trust it to keep growing."
...
In small-scale gold mining, UNIDO estimates, two to five grams of mercury are released into the environment for every gram of gold recovered—a staggering statistic, given that mercury poisoning can cause severe damage to the nervous system and all major organs. According to Peru­vian environmentalists, the mercury released at La Rinconada and the nearby mining town of Ananea is contaminating rivers and lakes down to the coast of Lake Titicaca, more than a hundred miles away.

View Larger Map

Tuesday, November 24, 2009

Precious Metals Trends

Google Precious Metals Trends


Search trend factors as of 2009-11-24:
Gold      1.0
Silver 0.57
Platinum 0.18
Palladium 0.04
Rodium 0.0