STOCKscreener. i n f o has now chart books. They let you flip through a lot of stock charts in a short amount of time.
This gives you a feel for what an extensive range of stocks are doing at the moment, where they are coming from, makes you accustomed with a lot of shares you haven't followed yet, or let's you scan for interesting stocks worth putting under further scrutiny.
You could start with the short Indices selection. If your appetite has been wetted, there are more chart books for the Euro Stoxx 50, DAX, SMI, and a bigger selection of German and Swiss stocks. There is also a chart book for the Dow Jones, thought it does not have much more than six months of a history yet for most stocks.
For each chart book you can select your preferred time frame, from 2 months to the maximum history available.
Wednesday, January 30, 2008
Saturday, January 26, 2008
A Panel Of CEOs
Have a look at 5 CEOs from Swiss Re, Renault/Nissan, Reuters, Nike, and AMD; in particular Jacques Aigrain, Carlos Ghosn, Thomas H. Glocer, Mark G. Parker, and Hector de Ruiz.
World Economic Forum Annual Meeting 2008 - The Power of Collaborative Innovation
World Economic Forum Annual Meeting 2008 - The Power of Collaborative Innovation
SocGen Fraud And Market Crash A Coincidence?
How do you sell Futures over EUR 50 billion without affecting the marked (with all those sharp automated trading systems out there moving, well, A LOT of money in an instance), or, had the market not taken a dive, would there have been any loss and therefore fraud at Shock Gen at all?
NY Times: Société Générale’s Sales May Have Incited Market Plunge
German speaking N24 TV: Kontenverschleierung bei SocGen kein Einzelfall
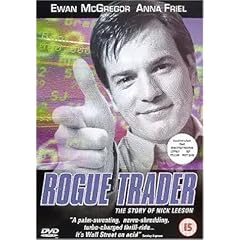
Can't wait for the next movie, aeh, more details.

From Reuters: French police step up investigation into SocGen fraud
NY Times: Société Générale’s Sales May Have Incited Market Plunge
German speaking N24 TV: Kontenverschleierung bei SocGen kein Einzelfall
Can't wait for the next movie, aeh, more details.
From Reuters: French police step up investigation into SocGen fraud
Jean-Pierre Mustier, head of SocGen's investment banking unit, told the Financial Times the rogue trader was managing hundreds of thousands of concealed trades and an equal number of fake hedges to give the appearance that any loss was offset.
"Every two or three days, he was changing his position. He would input a transaction that would trigger a control in three days and before that happened he would replace it with a different one," Mustier was quoted as saying.
SocGen has lodged a complaint with police based on three main charges -- fraudulent falsification of bank records, fraudulent use of such records and computer fraud. The three charges carry maximum prison terms of between 2 and 5 years.
Tuesday, January 22, 2008
iPhone Story
Wired: The Untold Story: How the iPhone Blew Up the Wireless Industry
So that summer, while he publicly denied he would build an Apple phone, Jobs was working on his entry into the mobile phone industry. In an effort to bypass the carriers, he approached Motorola. It seemed like an easy fix: The handset maker had released the wildly popular RAZR, and Jobs knew Ed Zander, Motorola's CEO at the time, from Zander's days as an executive at Sun Microsystems. A deal would allow Apple to concentrate on developing the music software, while Motorola and the carrier, Cingular, could hash out the complicated hardware details.
Of course, Jobs' plan assumed that Motorola would produce a successor worthy of the RAZR, but it soon became clear that wasn't going to happen. The three companies dickered over pretty much everything — how songs would get into the phone, how much music could be stored there, even how each company's name would be displayed. And when the first prototypes showed up at the end of 2004, there was another problem: The gadget itself was ugly.
Monday, January 21, 2008
Six-Sigma Events
Satire from n+1: Interview with a Hedge Fund Manager
n+1: What’s a “ten-sigma event”?
HFM: Meaning that it’s ten standard deviations from the mean… meaning it’s basically impossible, you know? But it’s kind of a joke, because returns are very fat-tailed, so the joke that we always say is, “Oh my God, today I had a loss that’s a six sigma event! I mean that’s the first time that’s happened in three months!” It’s like a one in ten-thousand-year event, and I haven’t had one in the last three months.
Sunday, January 20, 2008
Saturday, January 19, 2008
UBS - Union Bank of Singapore
Heard this joke just yesterday, but has been on the web already here as of December.
Friday, January 18, 2008
Casualty Finance
AMBAC's share price lost 70 % of its value in two days. Here are the performance numbers for the last two calendar years (and 2008 has hardly started):
2008 -75.79 %Here are the top specialists over a six months view (in alphabetical order):
2007 -71.07 %
New Century Financial Corp (delisted)
Mind you, some have seen their highs before. OK, because it is so much fun, here is a 12 month review:
Friday, January 11, 2008
Nassim Taleb TV Interview
Short interview of Nassim Nicholas Taleb, author of Fooled by Randomness as well as Black Swan:
WealthTrack 322 Part 2 | 11-30-07
WealthTrack 322 Part 2 | 11-30-07
Advance/Decline Ratio
STOCKscreener. i n f o shows now the Advance/Decline Ratio next to the market performance.
The A/D Ratio shows the relation between stocks that have increased in price against the ones which have decreased over the given time period and set of selected financial instruments.
Sometimes an index can be driven by price movements of just a few (maybe heavily weighted) stocks. The A/D Ratio gives you an idea how many stocks are "carrying" a certain market.
E.g. as of 2008-01-10 the Swiss Performance Index (SPI) is down only -3.1 % for the year. Thought the A/D Ratio looks much worse with: 42 / 182 = 0.23
BTW, the A/D Ratio for Japan for 2008 as of 2008-01-10 is as low as 0.11.
Tuesday, January 08, 2008
Special Charts
STOCKscreener.info has a new chart page.
What makes the charts on Stockscreener special?!
- go back in history
- permanent links
Normally financial sites offer you to go back a week, months, or some years, but mostly starting from today!
But that is not always what you want.
Sometimes you read up about some historical stock price movements or some example chart patterns in a book or blog.

It would be nice to go back and get a better, more detailed picture and see what has happened before and also scroll forward to see what has happened afterwards in history:

With Stockscreener you can do just that and freely select your start and end dates of interest. BTW, you can click on the image above for a larger version.
And next, like in this very blog post itself, wouldn't it be nice if you can easily reference and embed some chart sections into your web page or blog without having to copy paste an image from some web site, download it to your hard drive, do an upload to your web server, etc.?!
Now you can select the chart you are interested in on Stockscreener, including the size, and just copy paste the respective URL or section of HTML code. That's it. The image and its URL will stay permanent. Just click on any of the images here in this post to get to Stockscreener (or follow this chart link), scroll down and select the HTML code to embed the chart you need of any instrument and time frame you are interested in.
BTW, if you select a narrow date range, the charts will switch to HLOC bars:

Happy chart chatter!


What makes the charts on Stockscreener special?!
- go back in history
- permanent links
Normally financial sites offer you to go back a week, months, or some years, but mostly starting from today!
But that is not always what you want.
Sometimes you read up about some historical stock price movements or some example chart patterns in a book or blog.
It would be nice to go back and get a better, more detailed picture and see what has happened before and also scroll forward to see what has happened afterwards in history:
With Stockscreener you can do just that and freely select your start and end dates of interest. BTW, you can click on the image above for a larger version.
And next, like in this very blog post itself, wouldn't it be nice if you can easily reference and embed some chart sections into your web page or blog without having to copy paste an image from some web site, download it to your hard drive, do an upload to your web server, etc.?!
Now you can select the chart you are interested in on Stockscreener, including the size, and just copy paste the respective URL or section of HTML code. That's it. The image and its URL will stay permanent. Just click on any of the images here in this post to get to Stockscreener (or follow this chart link), scroll down and select the HTML code to embed the chart you need of any instrument and time frame you are interested in.
BTW, if you select a narrow date range, the charts will switch to HLOC bars:
Happy chart chatter!
Monday, January 07, 2008
Asian Investment Spree
One aspect of globalisation, the money is flowing back...
Bloomberg: Sovereign Funds Invest Where Buffett Won't: Michael R. Sesit
Bloomberg: Sovereign Funds Invest Where Buffett Won't: Michael R. Sesit
In the past two years, sovereign wealth funds and Chinese financial institutions invested at least $77.2 billion in Western banks and money managers. About $66.6 billion of that was placed in the last three quarters of 2007, accelerated by banks' needs for capital infusions after being battered by the subprime- mortgage crisis and related credit crunch.
...
Bottom line: ``Owning a big American bank is a bit like owning a big American automobile company, or a big American newspaper, or, for that matter, the U.S. dollar,'' Dalio said. ``For all of them, the memory of what it was carries a certain cache that tends to make it trade for more than its real value in the modern world.''
Perhaps the most telling evidence that sovereign funds may be buying pigs in a poke is billionaire Warren Buffett's rebuff to U.S. financial institutions seeking cash infusions. ``So far, we have not seen a deal that causes me to start salivating,'' the chairman of Omaha, Nebraska-based Berkshire Hathaway Inc. said in a Dec. 26 interview on CNBC. Of course, Buffett isn't averse to all banks. Berkshire Hathaway is the biggest shareholder in Wells Fargo & Co. and the second-largest in M&T Bank Corp.
Sunday, January 06, 2008
Dollar Devaluation
Entry fee at the Taj Mahal in India used to be USD 5, nine years ago. Now it is up to USD 20 thanks to foreign exchange rate changes:).
Your Money’s No Good
Your Money’s No Good
Saturday, January 05, 2008
World Indices 2007/8
Last year is just over and we can look back now how the world indices performed in 2007:
World Indices 2007
If you want to follow how the world indices develop on a year to date basis in 2008:
World Indices 2008
Of course, you can also follow the indices on a daily basis:
World Indices Last Close
Want more than 10 years?
World Indices Since 1998
World Indices 2007
If you want to follow how the world indices develop on a year to date basis in 2008:
World Indices 2008
Of course, you can also follow the indices on a daily basis:
World Indices Last Close
Want more than 10 years?
World Indices Since 1998
Wednesday, January 02, 2008
Momentum at WWW.PVI.CH
Philipp Vontobel wrote about RSL (Relative Strength) on his Investment Blog at the end of 2006. I pointed him to the new Momentum feature at STOCKscreener. i n f o and he mentions it on his blog today.
His site is in German, has some attention for the Swiss stock market and has good explanations, e.g. of resistance levels. From time to time there are also some chart guessing games, which should be good practice.
Momentum / RSL (2008-01-02)
RSL / Relative Stärke (2006-12-17)
His site is in German, has some attention for the Swiss stock market and has good explanations, e.g. of resistance levels. From time to time there are also some chart guessing games, which should be good practice.
Momentum / RSL (2008-01-02)
RSL / Relative Stärke (2006-12-17)
Buffett Partnership Letters
Warren Buffett: Letters to Partners
Those are not the Berkshire Hathaway shareholder letters but the older and a bit harder to get by letters from his prior investment partnership.
Those are not the Berkshire Hathaway shareholder letters but the older and a bit harder to get by letters from his prior investment partnership.
Tuesday, January 01, 2008
Momentum Stocks (RSL)
I got stimulated by the Swiss magazine Stocks, which has in each issue one page with a list of the best Swiss momentum stocks. They measure momentum by the RSL indicator. RSL stands for Relative Strengh by Levy.
It is easily calculated:
RSL = (last closing price / 15 month moving average) * 100
So e.g. if a stock's closing price is 20 % above its 15 month moving average, then its RSL value is 120.
Now you can see the list of Swiss momentum stocks updated daily on stockscreener.info. In addition, there is a momentum list for indices, the world, USA, the Euro zone, Great Britain, France, and Germany.
Subscribe to:
Posts (Atom)