Showing posts with label original. Show all posts

Tuesday, June 30, 2015

World's Biggest Companies

2015-06-30
 
Source: Thomson Reuters Datastream
 
In CHF billion.
 
Market Capitalization
 
No CCY Name CHF Bln. Fiscal Year
1 USD APPLE 666.75 14-09-27
2 USD GOOGLE 'A' 339.12 14-12-31
3 USD MICROSOFT 333.58 14-06-30
4 USD EXXON MOBIL 321.82 14-12-31
5 USD BERKSHIRE HATHAWAY 'A' 312.85 14-12-31
6 HKD PETROCHINA 'H' 287.33 14-12-31
7 USD WELLS FARGO & CO 268.28 14-12-31
8 HKD INDL.& COML.BK.OF CHINA 'H' 268.06 14-12-31
9 USD JOHNSON & JOHNSON 251.74 14-12-28
10 USD GENERAL ELECTRIC 249.46 14-12-31
 
Sales
 
No CCY Name CHF Bln. Fiscal Year
1 USD WAL MART STORES 451.35 15-01-31
2 HKD CHINA PTL.& CHM. 'H' 402.92 14-12-31
3 GBP ROYAL DUTCH SHELL A 362.10 14-12-31
4 HKD PETROCHINA 'H' 342.05 14-12-31
5 USD EXXON MOBIL 339.00 14-12-31
6 GBP BP 314.29 14-12-31
7 EUR VOLKSWAGEN PREF. 209.78 14-12-31
8 GBP GLENCORE INTERNATIONAL 196.51 14-12-31
9 JPY TOYOTA MOTOR 194.64 14-03-31
10 USD BERKSHIRE HATHAWAY 'A' 180.92 14-12-31
 
Net Income
No CCY Name CHF Bln. Fiscal Year
1 HKD INDL.& COML.BK.OF CHINA 'H' 41.32 14-12-31
2 USD APPLE 36.72 14-09-27
3 HKD CHINA CON.BANK 'H' 34.14 14-12-31
4 USD EXXON MOBIL 30.22 14-12-31
5 HKD BANK OF CHINA 'H' 25.41 14-12-31
6 USD MICROSOFT 20.51 14-06-30
7 USD WELLS FARGO & CO 20.28 14-12-31
8 USD JP MORGAN CHASE & CO. 18.67 14-12-31
9 USD BERKSHIRE HATHAWAY 'A' 18.47 14-12-31
10 USD CHEVRON 17.88 14-12-31

A few observations:

1. The top three companies by market cap now are all (kind of) software companies.

2. The next two companies by market cap are the only two companies that are in all three top 10 lists, market cap, sales, and net income. For Berkshire Hathaway, that is a little amazing, as it is not only a business conglomerate that is heavy in finance, which traditionally has comparatively lower revenues, but also is a holding company. E.g. it is a big shareholder of Wells Fargo, another top ten company by market cap _and_ net income (the later ones don't get attributed in proportion to Berkshire).

3. By sales, five top 10 companies are oil companies. All in the top six, only "topped" by Wal Mart. Glencore is another commodities company, that makes them six. Two car companies with traditionally very high sales. So Berkshire is quiet outstanding here. But who knows, Apple is not so far away..

4. By net income, three of the top five companies are Chinese banks. Now, I don't know if you can trust the official Chinese accounting, or if there is any transparent accounting of a bank's books at all, let alone both (I remember when Citi had a 20 billion USD profit year before Lehman), but it seems, China is definitely back on the scene. There are two more banks in the list, makes it 5 out of 10! JP Morgan seems to be untethered from the crisis (strange, isn't it)? Oh, and if you didn't know, Bank of China is not the biggest Chinese bank. ICBC is the one to remember. In case..

5. General Electric, once the champion itself, still made the top ten by market cap, but barely on rank ten. Still better than the likes of Wal-Mart, Cisco, or the total bankruptcy of General Motor. Still high on the list are Microsoft and Exxon however. Not sure Petrochina was on the top spot not so long ago as well.


Wednesday, October 09, 2013

High End Mass Camera Market

A look at the high end mass camera market: Full-Frame Camera Mind Share

Wednesday, March 13, 2013

Gold in CHF: Major Highs and Lows


The above chart (click to enlarge) has the Swiss Franc's gold price's major lows and highs of the last ten years (almost) since the low of CHF 471.85 on 2003-08-05.

I made the chart recently for the standard gold price in USD, so this is a check how much the look differs in CHF.

So below are the longest lasting periods to get a next major high in CHF.

In comparison to USD, in CHF we are only in the seventh longest draught in this ten year big uptrend and with -12.52 % draw down this time not out of line compared to previous periods. However, the last two recent periods combined do look a bit flat and do add up to soon 400 business days.

BTW, the number of periods with higher highs and higher lows in CHF is almost double the ones than if looked at in USD.

But whatever, time will tell:).

Major Highs

High No. 1
Date range:                   2006-05-11 - 2008-02-21
Length in business days:      465
High:                         874.98
Low:                          695.05
Draw down during this period: -20.56 %

High No. 2
Date range:                   2004-04-02 - 2005-06-23
Length in business days:      319
High:                         544.83
Low:                          482.57
Draw down during this period: -11.43 %

High No. 3
Date range:                   2010-06-08 - 2011-08-23
Length in business days:      315
High:                         1'435.80
Low:                          1'211.12
Draw down during this period: -15.65 %

High No. 4
Date range:                   2011-09-09 - 2012-10-04
Length in business days:      266
High:                         1'640.32
Low:                          1'442.72
Draw down during this period: -12.05 %

High No. 5
Date range:                   2008-02-21 - 2009-02-20
Length in business days:      261
High:                         1'041.00
Low:                          818.89
Draw down during this period: -21.34 %

High No. 6
Date range:                   2009-02-20 - 2009-12-04
Length in business days:      205
High:                         1'172.34
Low:                          989.26
Draw down during this period: -15.62 %

High No. 7
Date range:                   2012-10-04 - today
Length in business days:      113
High:                         1'669.74
Low:                          1'460.74
Draw down during this period: -12.52 %

High No. 8
Date range:                   2006-01-09 - 2006-05-11
Length in business days:      88
High:                         693.69
Low:                          693.15
Draw down during this period: -0.08 %

High No. 9
Date range:                   2009-12-04 - 2010-03-05
Length in business days:      65
High:                         1'223.16
Low:                          1'124.61
Draw down during this period: -8.06 %

Thursday, March 07, 2013

Gold Major Highs and Lows


The above chart (click to enlarge) has the gold price's major lows and highs (London fix) of the last decade since the very low of USD 252.80 on 1999-07-20.

Nevertheless, it has also been some time since the last all time high of USD 1'895.00 on 2011-09-05, and right now the gold price is closer to the last major low of USD 1'531.00 than making a new all time high. However there have been three other instances during this time frame in which it took even longer to make a next higher high (but that might go down to only two in another three weeks), and also where the draw down has been also bigger in the area of -20 to -30 %. See the details below.

Anyway, just some reading in the tea leaves, or in other words - the trend is your friend, until the bend at the end.
Major Highs

High No. 1
Date range:                   1999-10-05 - 2002-05-29
Length in business days:      669
High:                         325.50
Low:                          255.95
Draw down during this period: -21.37 %

High No. 2
Date range:                   2006-05-12 - 2008-03-17
Length in business days:      462
High:                         725.00
Low:                          560.75
Draw down during this period: -22.66 %

High No. 3
Date range:                   2008-03-17 - 2009-09-17
Length in business days:      378
High:                         1'011.25
Low:                          712.50
Draw down during this period: -29.54 %

High No. 4
Date range:                   2011-09-05 - today
Length in business days:      364
High:                         1'895.00
Low:                          1'531.00
Draw down during this period: -19.21 %

High No. 5
Date range:                   2004-12-02 - 2005-10-11
Length in business days:      214
High:                         454.20
Low:                          411.10
Draw down during this period: -9.49 %

High No. 6
Date range:                   2002-05-29 - 2003-02-05
Length in business days:      173
High:                         327.05
Low:                          302.25
Draw down during this period: -7.58 %

High No. 7
Date range:                   2004-04-01 - 2004-12-02
Length in business days:      170
High:                         427.25
Low:                          375.00
Draw down during this period: -12.23 %

High No. 8
Date range:                   2003-02-05 - 2003-10-03
Length in business days:      145
High:                         382.10
Low:                          319.90
Draw down during this period: -16.28 %

High No. 9
Date range:                   2009-12-02 - 2010-06-28
Length in business days:      139
High:                         1'212.50
Low:                          1'058.00
Draw down during this period: -12.74 %

High No. 10
Date range:                   2003-10-03 - 2004-04-01
Length in business days:      126
High:                         384.25
Low:                          370.25
Draw down during this period: -3.64 %

Saturday, April 21, 2012

Gold Line

FIXPM.LBM chart
Gold is pretty much in line for the last ten years...

Friday, September 16, 2011

Biggest Brokest Banks

Biggest banks by assets for the business year of 2010 in CHF billion:


Broken banks according to the market as of the close of 2011-09-15 by percentage of market capitalization in relation to their assets (aeh, basically liabilities;-):


Data source: Thomson Reuters Datastream

Thursday, September 01, 2011

Busting Banks

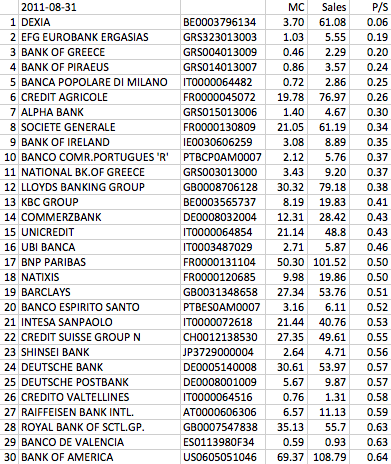
busting banks
Bank price sales multiples for 2011-08-31, market cap and sales in CHF billion.

Data source: Thomson Reuters Datastream

Friday, August 12, 2011

Platinum Gold Ratio

On 2011-08-09 the Platinum Gold ratio hit 1 to 1. As you can see in the chart below, this is happening the third time in the last 10+ years. And it hasn't gone much lower historically nor did it stay there for very long. And it makes sense. Platinum is the rarer, finer, heavier, more precious "White Gold"! Since then actually Gold has retreated a bit and Platinum moved slightly up again. We will see...


XPTXAU.LBM chart

Sunday, June 12, 2011

Tire Tycoons

Tire companies and their market caps in CHF billion, source Thomson DataStream, 2011-06-12:

Sunday, June 05, 2011

Car Companies

Car companies and their market caps in CHF billion, source Thomson DataStream, 2011-06-05:

Saturday, November 27, 2010

Liechtenstein

Liechtenstein, Vaduz
Bank Assets under Management,
2010-06-30

LGT CHF 86.8 bn
LLB CHF 46.4 bn
VPB CHF 40.5 bn
============
Total CHF 173.7 bn
2010-10-31


 1. 2.
 3. 4.
 5. 6.
 7. 8.
 9. 10.
 11. 12.
 13. 14.
 15. 16.
 17.

Thursday, August 05, 2010

Kleingeld

Pocket change currently in use:

NoFractional CurrencyCountries
1.Cent28
2.Centavo16
3.Cents10
4.Centime9
5.Fils6
6.Centimes4
7.Sen4
8.Centesimo3
9.Centimos3
10.Bani2
11.Centavos2
12.Centimo2
13.Chon2
14.Dirham2
15.New Pence / Pence2
16.Ore2
17.Paisa2
18.Piastres2
19.Agorot1
20.Att1
21.Aurar (inactive)1
22.Avos1
23.Baizas1
24.Bututs1
25.Cantimo1
26.Centas1
27.Centesimos1
28.Chetrum1
29.Deni1
30.Dinar1
31.Diram1
32.Fen1
33.Fening1
34.Filler1
35.Ghana Pesewas1
36.Groszy1
37.Haleru1
38.Hallalas1
39.Hellers1
40.Iraimbilanja1
41.Khoums1
42.Kobo1
43.Kopek1
44.Kopeken1
45.Kurus1
46.Laari1
47.Lipa1
48.Lisente1
49.Lumma1
50.Millimes1
51.Mongo1
52.New Pence1
53.Ngwee1
54.Oere1
55.Paise1
56.Para1
57.Pence1
58.Piaster1
59.Piastre1
60.Poisha1
61.Pyas1
62.Qapik1
63.Qindarka1
64.Rappen1
65.Santims1
66.Satang1
67.Sene1
68.Seniti1
69.Senti1
70.Stotinki1
71.Tambala1
72.Tenge1
73.Tetri1
74.Thebe1
75.Tiin1
76.Tijin1
77.Toea1
78.Tyin1
79.XU1

Source: SIX Telekurs

Sunday, June 20, 2010

BP Reporting

This is all that is mentioned in the BP first quarter of 2010 report:
On 20 April 2010, the semi-submersible drilling rig Deepwater Horizon owned and operated by Transocean Limited caught fire in the US Gulf of Mexico and subsequently sank. The rig was drilling an exploration well on a BP deepwater lease. BP is committed to doing everything in its power to contain the environmental consequences of the incident.
Not even the death of the 11 people is mentioned.

What is also very interesting from the 2009 annual report:
Total exploration expense in 2009 of $1,116 million (2008 $882 million and 2007 $756 million) included the write-off of expenses related to unsuccessful drilling activities in the deepwater Gulf of Mexico ($391 million), India ($31 million), Angola ($28 million), Egypt ($27 million), and others ($31 million).
Put this in relation to this quote from a Deepwater Horizon witness:
[Mike Williams, the chief electronics technician on the Deepwater Horizon, and one of the last workers to leave the doomed rig] said they were told it would take 21 days; according to him, it actually took six weeks.

With the schedule slipping, Williams says a BP manager ordered a faster pace.

"And he requested to the driller, 'Hey, let's bump it up. Let's bump it up.' And what he was talking about there is he's bumping up the rate of penetration. How fast the drill bit is going down," Williams said.

Williams says going faster caused the bottom of the well to split open, swallowing tools and that drilling fluid called "mud."

"We actually got stuck. And we got stuck so bad we had to send tools down into the drill pipe and sever the pipe," Williams explained.

That well was abandoned and Deepwater Horizon had to drill a new route to the oil. It cost BP more than two weeks and millions of dollars.


"We were informed of this during one of the safety meetings, that somewhere in the neighborhood of $25 million was lost in bottom hole assembly and 'mud.' And you always kind of knew that in the back of your mind when they start throwing these big numbers around that there was gonna be a push coming, you know? A push to pick up production and pick up the pace," Williams said.

Asked if there was pressure on the crew after this happened, Williams told Pelley, "There's always pressure, but yes, the pressure was increased."
Now, how much is actually produced by BP down there in different fields in the Gulf every day?
Field                 2009
Thunder Horse 133'000 bpd
Atlantis 54'000 bpd
Mad Dog 35'000 bpd
Mars 29'000 bpd
Na Kika 27'000 bpd
Horn Mountain 25'000 bpd
King 22'000 bpd
Other 62'000 bpd
Total 387'000 bpd
So make your own guess, how much is coming out there free flowing every day!

Here is what Mad Hedge is worried about:
All of BP’s efforts to date have really been “Hail Mary’s” doomed to failure. The only real chance is to relieve the pressure by drilling several adjacent wells, and that will take months. If BP has discovered the mother of all fields with pressures so enormous, they can’t be controlled with modern technology, a possibility which some geologists admit, then more huge leaks will spring and the nuclear option will be the only one left. In the meantime, if a serious hurricane hits the region, a mathematical probability, then we will see the environmental equivalent of Chernobyl meets Katrina. In this scenario, you can kiss BP goodbye.
So how big could the field be, how much oil is down there that could potentially come up?

From Bloomberg: Anadarko Says BP Should Pay After Being Reckless
1 Billion Barrels?

The ruptured well may hold as much as 1 billion barrels, the Times reported, citing Rick Mueller, an analyst at Energy Security Analysis in Massachusetts. BP previously estimated the field contained 50 million to 100 million barrels of oil, the U.K. newspaper said.
For comparison, Exxon Valdez spilled 0.27 million barrels into the sea. Around a million is estimated to have come already out of the current leak. BTW, BP has total net proved crude oil reserves (not considering natural gas reserves) of 10.5 billion barrels.

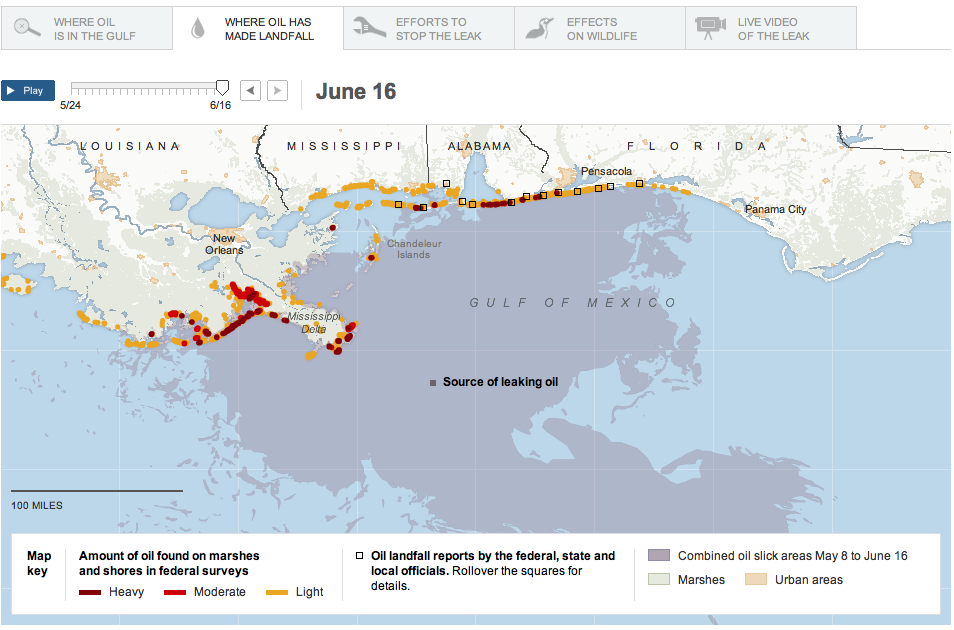
Not that there isn't already enough oil out there in the sea (NYTimes graphic via The Big Picture):


Last not least, zero hedge has lots of interesting topographical sea maps of the area around spill:

Sunday, May 16, 2010

Financial Fraud System

Some years ago when starting to work at a bank, I was wondering what could be the maximum amount possible to steal from a bank. After a certain threshold, a whole army would come after them, wouldn't they? Of course, unless everything gets stolen, then the thiefs are the one with the army anyway?! And that's how it turned out. The whole western capitalistic system has been subverted. And as every banker has become a bankster, it is even impossible to pinpoint any individuals. Coup d'etat. Let's see what will follow. Europe has just capitulated too. Yes, why rob a bank when you can work for one (Mr. Dougan)?! And BTW, as the final name of this crisis is still out, my pick would be "Accounting Crisis". But then, maybe just a matter of time to attach the word Catastrophe onto it.

James K. Galbraith via Jesse's Cafe Americain: The US Intelligentsia and Middle Class Are In the Firm Grip of Fear, Fraud and Denial
Thus the study of financial fraud received little attention. Practically no research institutes exist; collaboration between economists and criminologists is rare; in the leading departments there are few specialists and very few students. Economists have soft-pedaled the role of fraud in every crisis they examined, including the Savings & Loan debacle, the Russian transition, the Asian meltdown and the dot.com bubble. They continue to do so now. ...

There are exceptions. A famous 1993 article entitled "Looting: Bankruptcy for Profit," by George Akerlof and Paul Romer, drew exceptionally on the experience of regulators who understood fraud. The criminologist-economist William K. Black of the University of Missouri-Kansas City is our leading systematic analyst of the relationship between financial crime and financial crisis. Black points out that accounting fraud is a sure thing when you can control the institution engaging in it: "the best way to rob a bank is to own one." The experience of the Savings and Loan crisis was of businesses taken over for the explicit purpose of stripping them, of bleeding them dry. This was established in court: there were over one thousand felony convictions in the wake of that debacle. Other useful chronicles of modern financial fraud include James Stewart's Den of Thieves on the Boesky-Milken era and Kurt Eichenwald's Conspiracy of Fools, on the Enron scandal. Yet a large gap between this history and formal analysis remains.

...

The complexity of the mortgage finance sector before the crisis highlights another characteristic marker of fraud. In the system that developed, the original mortgage documents lay buried – where they remain – in the records of the loan originators, many of them since defunct or taken over. Those records, if examined, would reveal the extent of missing documentation, of abusive practices, and of fraud. So far, we have only very limited evidence on this, notably a 2007 Fitch Ratings study of a very small sample of highly-rated RMBS, which found "fraud, abuse or missing documentation in virtually every file."

...

Latter-day financial economics is blind to all of this. It necessarily treats stocks, bonds, options, derivatives and so forth as securities whose properties can be accepted largely at face value, and quantified in terms of return and risk. That quantification permits the calculation of price, using standard formulae. But everything in the formulae depends on the instruments being as they are represented to be. For if they are not, then what formula could possibly apply?

An older strand of institutional economics understood that a security is a contract in law. It can only be as good as the legal system that stands behind it. Some fraud is inevitable, but in a functioning system it must be rare. It must be considered – and rightly – a minor problem. If fraud – or even the perception of fraud – comes to dominate the system, then there is no foundation for a market in the securities. They become trash. And more deeply, so do the institutions responsible for creating, rating and selling them. Including, so long as it fails to respond with appropriate force, the legal system itself.

Control frauds always fail in the end. But the failure of the firm does not mean the fraud fails: the perpetrators often walk away rich. At some point, this requires subverting, suborning or defeating the law. This is where crime and politics intersect. At its heart, therefore, the financial crisis was a breakdown in the rule of law in America.

Ask yourselves: is it possible for mortgage originators, ratings agencies, underwriters, insurers and supervising agencies NOT to have known that the system of housing finance had become infested with fraud? Every statistical indicator of fraudulent practice – growth and profitability – suggests otherwise. Every examination of the record so far suggests otherwise. The very language in use: "liars' loans," "ninja loans," "neutron loans," and "toxic waste," tells you that people knew. I have also heard the expression, "IBG,YBG;" the meaning of that bit of code was: "I'll be gone, you'll be gone."

...

But you have to act. The true alternative is a failure extending over time from the economic to the political system. Just as too few predicted the financial crisis, it may be that too few are today speaking frankly about where a failure to deal with the aftermath may lead.

In this situation, let me suggest, the country faces an existential threat. Either the legal system must do its work. Or the market system cannot be restored. There must be a thorough, transparent, effective, radical cleaning of the financial sector and also of those public officials who failed the public trust. The financiers must be made to feel, in their bones, the power of the law. And the public, which lives by the law, must see very clearly and unambiguously that this is the case.

Saturday, May 01, 2010

Pharmacy Sales


The biggest pharmacy companies ranked by sales - half a trillion USD in total. To put it in perspective, all sales of Wal-Mart are at USD 405 bia. The company price to sales ratio for the big pharma sector is 2.65 (0.5 for Wal-Mart, just to give the number).

Sources: SIX Telekurs, FactSet, theScreener

Monday, April 19, 2010

Pharmacy Stocks


Pharmacy for USD 1.1 trillion.

Sources: SIX Telekurs, theScreener

Oil Companies

2010-04-16

Market Cap 
USD Bia Company Dom. Market Cur.

333.07 PetroChina CN HKG HKD
323.40 Exxon Mobil US NYX USD
189.13 Royal Dutch Shell GB LSS GBP
186.75 BP GB LSS GBP
185.24 Petroleo Bras Pfd BR SAO BRL
161.83 Chevron US NYX USD
139.22 Total FR EPA EUR
132.70 Sinopec CN HKG HKD
96.93 Eni IT MCI EUR
91.62 Rosneft Oil RU RTD USD
86.87 ConocoPhillips US NYX USD
78.51 CNOOC HK HKG HKD
77.96 Statoil NO OSL NOK
69.98 Occid.Petrol Corp US NYX USD
51.25 Lukoil RU RTD USD
36.39 Apache US NYX USD
30.68 Repsol YPF ES MCE EUR
29.99 Devon Energy US NYX USD
23.28 Marathon Oil US NYX USD
2'324.80
Sources: SIX Telekurs, theScreener

Thursday, February 25, 2010

Euro STOXX 50 in Gold OZ

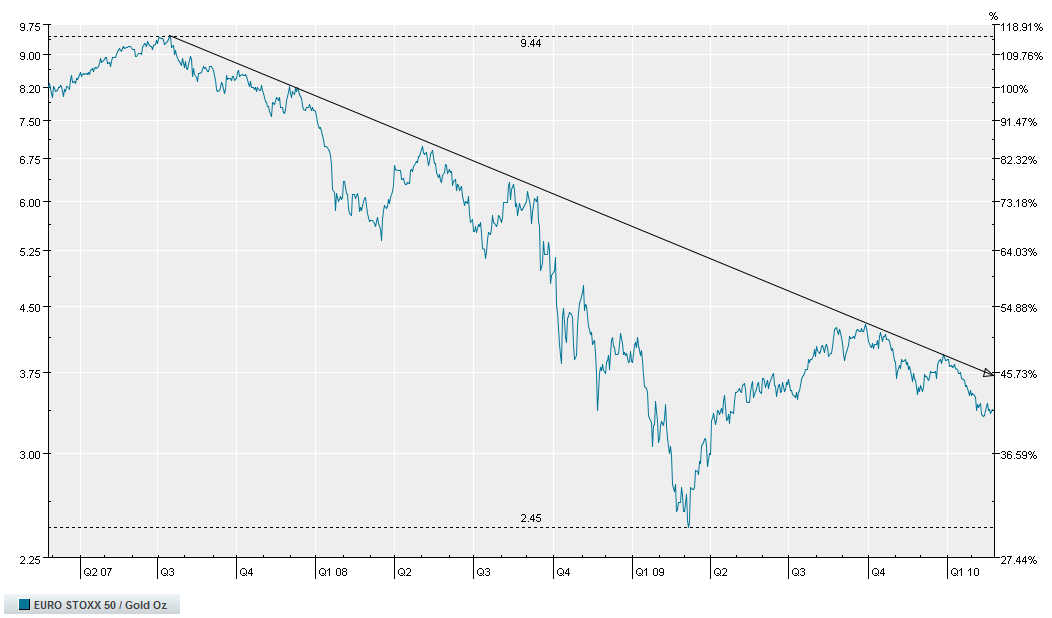
With talk recently about Gold being on an all time high denominated in Euro, let's have a look at the most important European index, the Euro STOXX 50: in Gold troy ounces!

(click on image for a bigger version)


What a wonderful downward trend for the Euro STOXX 50 in Gold. Or could we call it deflation?! And maybe it's inflation for Gold in terms of Euro!? Inflation - Deflation: is it just a matter of perspective?

Source Telekurs iD.

Saturday, February 13, 2010

Gold

From the World Gold Council (a bunch of gold mining corporations):
How much gold has been mined?
The best estimates available suggest that the total volume of gold ever mined up to the end of 2009 was approximately 165'000 tonnes, of which around 65% has been mined since 1950.

How much gold is still underground?
The major gold producers increased their reported reserves to 719.7 million oz or over 22,000 tonnes at the end of 2005, according to Metals Economics Group. Assuming a 10% recovery loss when the ore is extracted, this would amount to 14 years of gold production at 2005's level. In practice the amount of known resources remains fairly constant over time since the results of new exploration finds replace those resources that are exploited.

What is the average cost of mining per ounce?
The average cost of replacing and producing an ounce of gold rose to $428/oz in 2005, a ten-year high, according to Metals Economics Group, based on a study of 18 major gold producing companies. However, costs vary widely between companies and the mines themselves.

How big is a tonne of gold?
Gold is traditionally weighed in Troy Ounces (31.1035 grammes). With the density of gold at 19.32 g/cm3, a troy ounce of gold would have a volume of 1.61 cm3. A metric tonne (equals 1,000kg = 32,150.72 troy ounces) of gold would therefore have a volume of 51,762 cm3 (i.e. 1.61 x 32,150.72), which would be equivalent to a cube of side 37.27cm (Approx. 1' 3'').

Where does the word Gold come from?
The word gold appears to be derived from the Indo-European root 'yellow', reflecting one of the most obvious properties of gold. This is reflected in the similarities of the word gold in various languages: Gold (English), Gold(German), Guld (Danish), Gulden (Dutch), Goud (Afrikaans), Gull (Norwegian) and Kulta (Finnish).
With today's gold price of USD 1082.00 the total "market capitalization" of gold is:

USD 5'739'872'784'897.15

USD 5.7 trillion - 9.5% of 2008 world GDP or half of the currently estimated US bailout amount:-)


And what's the annual mining production?

The CRB Commoditiy Yearbook 2008 states for 2005:
2'470 t (record high was actually 1999/2000 with 2'570 t)
= 79.41 million ozt (82.6 million ozt)
= USD 85'924'156'234.52
= USD 85.9 billion (USD 89.4 billion)
So total world gold amount is equivalent of 66.8 years of 2008 world gold production.
P.S. 1 ozt = 31.1034768 g


And how much gold is there for any human being?

165'000'000'000 g / 6'692'030'277 people = 24.66 g / person (or 80% of a single troy once)


Here is an interesting back of the envelope calculation (thought they estimate double the amount of the WGC number and maybe make a too low assumption of today's gold production, nevertheless interesting):

If you took all of the gold in the world and put it in one place how much would there be?


And a National Geographic article about gold, mining, and its social impact:
In 2007 demand outstripped mine production by 59 percent.
...
According to the United Nations Industrial Development Organization (UNIDO), there are between 10 million and 15 million so-called artisanal miners around the world, from Mongolia to Brazil. Employing crude methods that have hardly changed in centuries, they produce about 25 percent of the world's gold and support a total of 100 million people. It's a vital activity for these people—and deadly too.
So annually: 80 mio ozt * 25% = 20 mio ozt; for lets say 10 mio workers this results in 2 ozt per worker, average per worker USD 2'000 market value - thought not what they get:
On school holidays, Rosemery sometimes helps her mother on the mountain. It is child labor, perhaps, but for a girl whose family is living hand to mouth, it also qualifies as her proudest achievement. "Last year I found two grams of gold," Rosemery says, almost giddily. "It was enough to buy my schoolbooks and uniform.
And furthermore:
The deadly effects of mercury are equally hazardous to small-scale miners. Most use mercury to separate gold from rock, spreading poison in both gas and liquid forms. UNIDO estimates that one-third of all mercury released by humans into the environment comes from artisanal gold mining.
...

View Mine Sites in a larger map
At the other end of the spectrum are vast, open-pit mines run by the world's largest mining companies. Using armadas of supersize machines, these big-footprint mines produce three-quarters of the world's gold. They can also bring jobs, technologies, and development to forgotten frontiers. Gold mining, however, generates more waste per ounce than any other metal, and the mines' mind-bending disparities of scale show why: These gashes in the Earth are so massive they can be seen from space, yet the particles being mined in them are so microscopic that, in many cases, more than 200 could fit on the head of a pin. Even at showcase mines, such as Newmont Mining Corporation's Batu Hijau operation in eastern Indonesia, where $600 million has been spent to mitigate the environmental impact, there is no avoiding the brutal calculus of gold mining. Extracting a single ounce of gold there—the amount in a typical wedding ring—requires the removal of more than 250 tons of rock and ore.
...
Up the road there is a basketball gymnasium that Newmont staffers jokingly refer to as "the second home of the Denver Nuggets."

The name is fitting for a Colorado-based gold-mining company, though there are no nuggets here. And therein lies the problem. Higher prices and advanced techniques enable companies to profitably mine microscopic flecks of gold; to separate gold and copper from rock at Batu Hijau, Newmont uses a finely tuned flotation technology that is nontoxic, unlike the potentially toxic cyanide "heap leaching" the company uses in some of its other mines. Even so, no technology can make the massive waste generated by mining magically disappear. It takes less than 16 hours to accumulate more tons of waste here than all of the tons of gold mined in human history. The waste comes in two forms: discarded rock, which is piled into flat-topped mountains spread across what used to be pristine rain forest, and tailings, the effluent from chemical processing that Newmont pipes to the bottom of the sea.

This method of "submarine tailings disposal" is effectively banned in most developed countries because of the damage the metal-heavy waste can do to the ocean environment, and Newmont practices it nowhere but in Indonesia. Four years ago an Indonesian court brought criminal charges against a Newmont subsidiary—even jailing five of its employees for a month—for pumping pollutants into the sea near its now defunct Buyat Bay mine on the island of Sulawesi. Newmont was acquitted of all charges in 2007. Despite critics' claims that the court caved in to the mining industry, Newmont defends its reliance on ocean dumping at Batu Hijau. "Land disposal would be cheaper but more damaging to the environment," argues Rachmat Makkasau, Batu Hijau's senior process manager. The tailings at Batu Hijau are released 2.1 miles offshore at a depth of 400 feet, above a steep drop-off that carries the waste down more than 10,000 feet. "We closely monitor the quality of the tailings, pipes, and seabed," says Makkasau. "At that depth, we are only affecting some 'sea insects.'"
...
Nowhere is the gold obsession more culturally entrenched than it is in India. Per capita income in this country of a billion people is $2,700, but it has been the world's runaway leader in gold demand for several decades. In 2007, India consumed 773.6 tons of gold, about 20 percent of the world gold market and more than double that purchased by either of its closest followers, China (363.3 tons) and the U.S. (278.1 tons). India produces very little gold of its own, but its citizens have hoarded up to 18,000 tons of the yellow metal—more than 40 times the amount held in the country's central bank.

India's fixation stems not simply from a love of extravagance or the rising prosperity of an emerging middle class. For Muslims, Hindus, Sikhs, and Christians alike, gold plays a central role at nearly every turning point in life—most of all when a couple marries. There are some ten million weddings in India every year, and in all but a few, gold is crucial both to the spectacle and to the culturally freighted transaction between families and generations. "It's written into our DNA," says K. A. Babu, a manager at the Alapatt jewelry store in the southwestern city of Cochin. "Gold equals good fortune."

This equation manifests itself most palpably during the springtime festival of Akshaya Tritiya, considered the most auspicious day to buy gold on the Hindu calendar. The quantity of gold jewelry Indians purchase on this day—49 tons in 2008—so exceeds the amount bought on any other day of the year throughout the world that it often nudges gold prices higher.

View Larger Map
Throughout the year, though, the epicenter of gold consumption is Kerala, a relatively prosperous state on India's southern tip that claims just 3 percent of the country's population but 7 to 8 percent of its gold market. It's an unusual distinction for a region that has one of the world's only democratically elected Marxist governments, but it is rooted in history. A key port in the global spice trade, Kerala gained an early exposure to gold, from the Romans who offered coins in exchange for pepper, cardamom, and cinnamon to subsequent waves of colonizers, the Portuguese, Dutch, English. But local historians say it was the region's revolt against the Hindu caste system (before which the lowest castes were allowed to adorn themselves only with polished stones and bones), and the mass conversion to Christianity and Islam that followed, that turned gold into something more than commerce: a powerful symbol of independence and upward mobility.
...
By themselves, none of these ceremonies captures how deeply gold is ingrained in the Indian economy. "Gold is the basis of our financial system," says Babu, the jewelry store manager. "People see it as the best form of security, and nothing else lets you get cash as quickly." Hoarding gold as an intergenerational family nest egg is an ancient tradition in India. So, too, is pawning gold jewelry for emergency loans—and then buying it back. Commercial banks still offer the service, after their attempt to stop it in the 1990s resulted in riots and suicides by debt-laden clients and a government command to continue the practice.

Many farmers in Kerala, however, prefer the speed and easy access of "private financiers" like George Varghese, who operates out of his home three hours south of Cochin. A balding man in his 70s, Varghese says he handles around half a million dollars in pawned gold a month, even more during harvest and wedding seasons. It's almost a perfect business, for even with interest rates that can reach one percent a day on short-term loans, very few people default. No Indian wants to let go of their gold. "Even when gold hit $1,000 an ounce, nobody sold their jewelry or coins," says Varghese. "This is their nest egg, and they trust it to keep growing."
...
In small-scale gold mining, UNIDO estimates, two to five grams of mercury are released into the environment for every gram of gold recovered—a staggering statistic, given that mercury poisoning can cause severe damage to the nervous system and all major organs. According to Peru­vian environmentalists, the mercury released at La Rinconada and the nearby mining town of Ananea is contaminating rivers and lakes down to the coast of Lake Titicaca, more than a hundred miles away.

View Larger Map

Tuesday, January 12, 2010

Vetropack

VET.SWX chart
Some quick observations on the Vetropack 2008 annual report:

Average sales price per bottle or glass: CHF 0.18

Ukrainian currency fell in 4th quarter by 60%!
At the end of 2008, Vetropack's capacity totals 4'250 tons of glass per day in its 16 furnaces across seven locations.
Family owned business, holding is in Bülach, Swiss factory in St-Prex.
Content and Method of Determining Remuneration. The level of remuneration to members of
the BoD is determined by the BoD as a whole. Only cash benefits are paid. No share or option
plans exist. The level of remuneration to the members of the MB is determined by the Chairman of the BoD. In addition to a basic level of remuneration that reflects the responsibility borne by an individual, there is a variable performance related component based on the results of the business unit and/or the Group.
---
In 2007, glass recycling quotas reached 95% in Switzerland, 80% in Austria and 59% in Croatia. Recycling accounted for 34% in Slovakia, 50% in the Czech Republic and 23% in Ukraine.
Sales by Market Segments (4.27 billion units, 1.3 million tons of glass)

33% Beer
24% Wine
17% Food
11% Spirits
09% Mineral waters / carbonated beverages
06% Juice